# 安装prometheus
https://prometheus.io/download/ (opens new window)
下载解压后,直接运行 ./prometheus即可。
默认开启的端口是9090。
# 安装grafana
docker pull docker.io/grafana/grafana
docker run -d --name=grafana -p 3000:3000 grafana/grafana
1
2
2
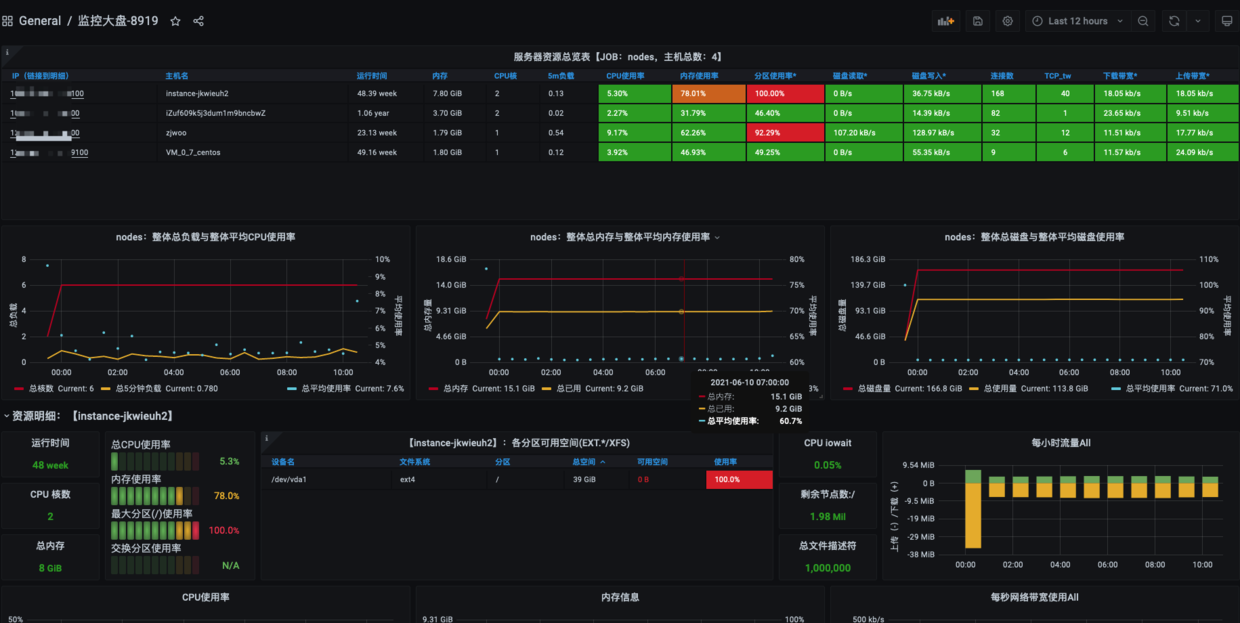
然后新增一个prometheus的数据源,选择 8919模版。
https://grafana.com/grafana/dashboards/8919 (opens new window)
默认开启的端口是3000
# 安装node_exporter
下载地址解压,运行即可。
默认开启的端口是9100。
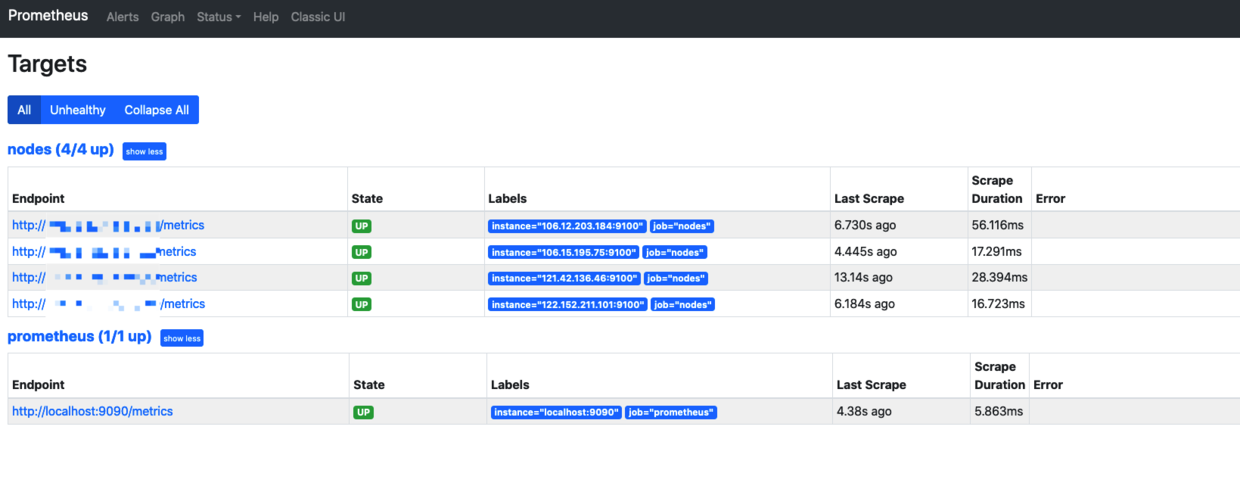
需要手动在 prometheus server端配置上节点。
scrape_configs:
  # The job name is added as a label `job=<job_name>` to any timeseries scraped from this config.
  - job_name: 'prometheus'

    # metrics_path defaults to '/metrics'
    # scheme defaults to 'http'.

    static_configs:
    - targets: ['localhost:9090']
  - job_name: 'nodes'
    static_configs:
    - targets:
      - "106.12.xxx.xxx:9100"
      - "106.15.xxx.xxx:9100"
      - "121.42.xxx.xxx:9100"
      - "122.152.xxx.xxx:9100"
1
2
3
4
5
6
7
8
9
10
11
12
13
14
15
16
2
3
4
5
6
7
8
9
10
11
12
13
14
15
16
# 文件的服务发现
上面的配置都是手动新增,我们利用新增配置文件,让server自定载入,服务发现即可。
# my global config
global:
  scrape_interval:     15s # Set the scrape interval to every 15 seconds. Default is every 1 minute.
  evaluation_interval: 15s # Evaluate rules every 15 seconds. The default is every 1 minute.
  # scrape_timeout is set to the global default (10s).

# Alertmanager configuration
alerting:
  alertmanagers:
  - static_configs:
    - targets:
      # - alertmanager:9093

# Load rules once and periodically evaluate them according to the global 'evaluation_interval'.
rule_files:
  # - "first_rules.yml"
  # - "second_rules.yml"


# A scrape configuration containing exactly one endpoint to scrape:
# Here it's Prometheus itself.


# A scrape configuration containing exactly one endpoint to scrape:
# Here it's Prometheus itself.
scrape_configs:
  # The job name is added as a label `job=<job_name>` to any timeseries scraped from this config.
  - job_name: 'prometheus'
  	file_sd_configs:
  	- files:												#指定加载的文件列表
  		- targets/prometheus-*.yaml		# 文件加载支持glob通配符
  		refresh_interval: 2m					# 每隔2分钟重新加载一次文件中定义的targets,默认5m

  - job_name: 'nodes'
		file_sd_configs:
		- files:
			- targets/nodes-*.yaml
			refresh_interval: 2m
1
2
3
4
5
6
7
8
9
10
11
12
13
14
15
16
17
18
19
20
21
22
23
24
25
26
27
28
29
30
31
32
33
34
35
36
37
38
2
3
4
5
6
7
8
9
10
11
12
13
14
15
16
17
18
19
20
21
22
23
24
25
26
27
28
29
30
31
32
33
34
35
36
37
38
targets/nodes-linux.yaml
- targets:
  - "106.12.xxx.xxx:9100"
  - "106.15.xxx.xxx:9100"
  - "121.42.xxx.xxx:9100"
  - "122.152.xxx.xxx:9100"
  labels:
    app:node_exporter
1
2
3
4
5
6
7
2
3
4
5
6
7
targets/prometheus-server.yaml
- targets:
  - "localhost:9090"
  labels:
    app:prometheus
1
2
3
4
2
3
4
# mysql监控
先在grafana里添加mysql的数据源。
将my2.sql文件导入数据库,https://github.com/john1337/my2Collector (opens new window)
用 https://grafana.com/grafana/dashboards/7991 (opens new window) 这个模版,最终展示即可。
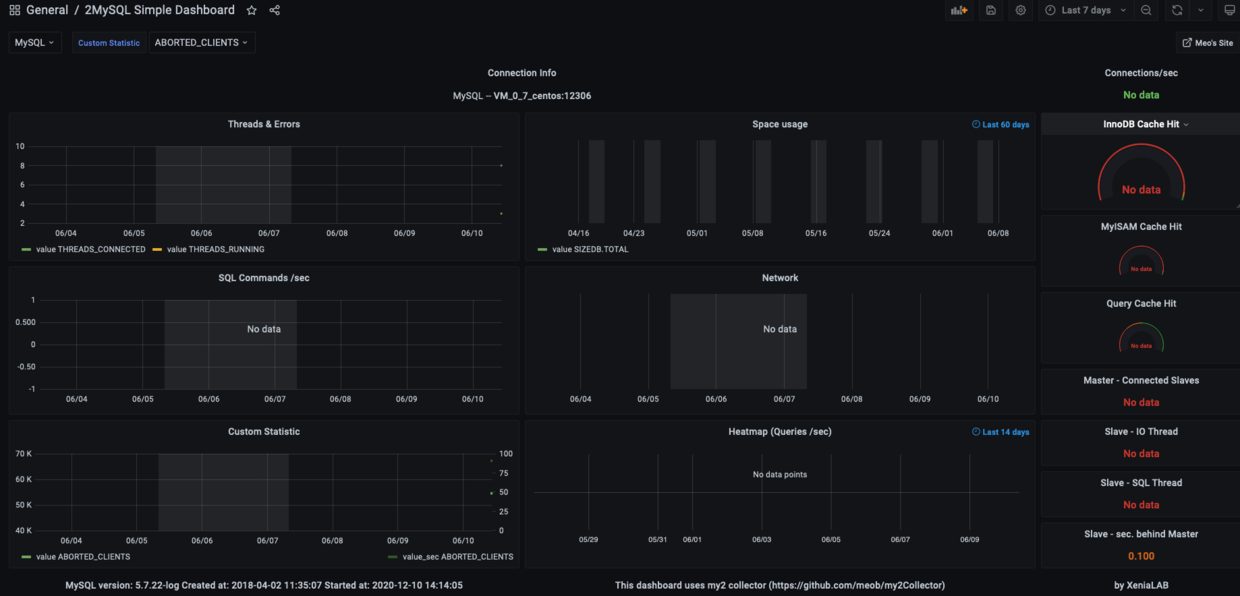
# 最终效果